


Lesson 1.1.4
Credits without surprises: read the badge before you run
What this costs
Free to read. The point of the lesson is that nothing surprises you afterwards.
Before you start
Nothing.
This is the most important lesson in the Akademy and the one the old version never had. Kuration charges in four different ways, every tool tells you which one it uses, and almost every "why did that cost so much" support ticket is someone who never looked.
Read the badge on the tool card
Everything in this lesson comes down to one habit. Open the Toolbox, find the tool you are about to use, and read the badge on its card. Every tool states its own price and its own charging behaviour there, and that badge is always current in a way no lesson or price list can be.
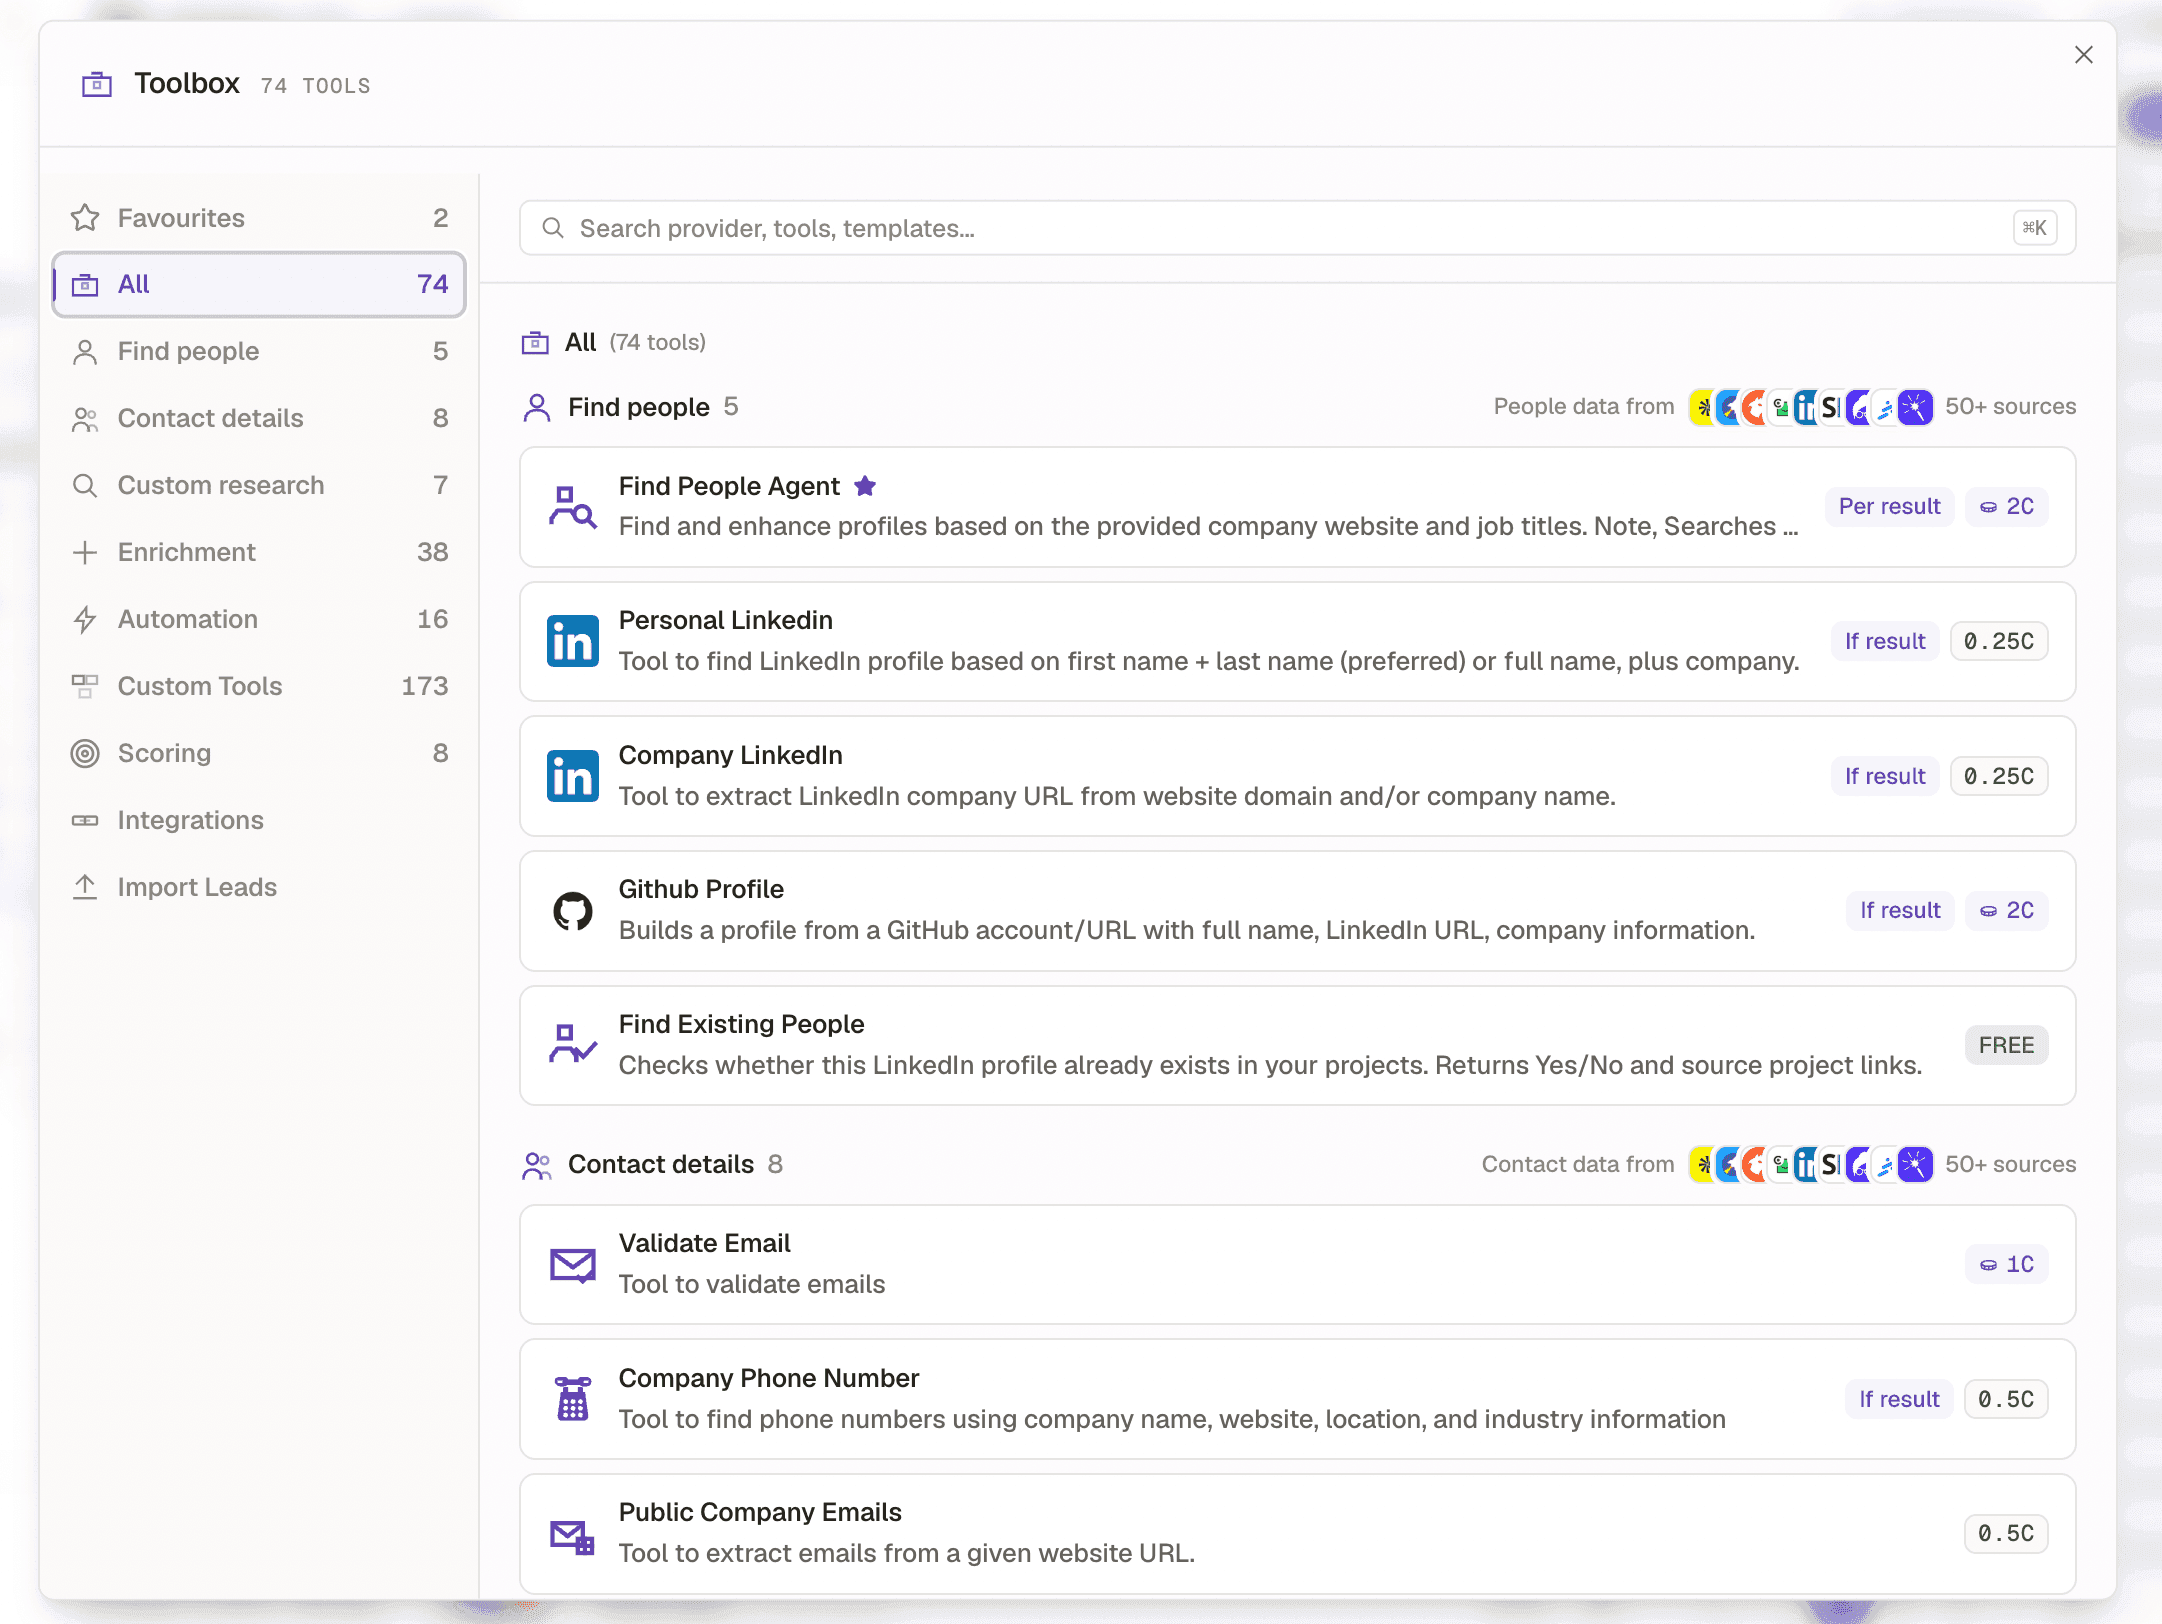
- 1Per result: charged per profile returned
- 2If result: a miss is free
- 3FREE: never charged
- 4No behaviour badge: every row charged
The four badges, and what each one means for a miss
| Badge on the card | You are charged | A miss costs you | Run it |
|---|---|---|---|
| FREE | Never | Nothing | As often as you like. Scoring lives here |
| A credit figure on its own | For every row the tool processes | The same as a hit | After filtering, never before |
| A figure plus If result | Only on rows where it returned a value | Nothing | Wide, on a filtered list |
| A figure plus Per result | Once per item returned, so one row can charge several times | Nothing | Wide, but cap what it returns per row |
The tools whose behaviour you should know by heart
| Tool | What to expect on the card | Why it matters |
|---|---|---|
| Scoring Agent | FREE | It reasons over data already in the row rather than researching. Score early, score often, and use the score to gate the paid columns |
| Official Website Finder | A flat per row figure | The dependency almost every other tool has. Run it on the rows that are missing a website, not on all of them |
| Find People | A figure plus Per result | One company can return several people. Budget on results |
| Waterfall Logic | FREE | Picks the first non empty value from several inputs, so you can chain cheap attempts before an expensive one |
| Verification and QA tools | A flat per row figure | A fail costs the same as a pass, because deciding it was a fail is the work |
| Custom Research Tool | A per row figure | Preview on five rows before you create the column across the table |
Predicting a run before you press it
Work it out per column, not per project. For each column you are about to create: how many rows will it actually run on after filters, what does the card say one unit costs, and does a miss cost anything.
Here is the same 1,000 sourced companies built two ways. The unit prices below are made up for the arithmetic. Substitute whatever your own tool cards say, because the shape of the result is the point rather than the totals.
Worked example · The same 1,000 companies, flat versus curated first
| Step | Without curating | Curating first |
|---|---|---|
| Rows after sourcing | 1,000 | 1,000 |
| Filter on what the source gave you, free | skipped | 380 remain |
| Website Finder, say 2 credits a row | 2,000 | 760 |
| Score against your ICP, free | 0 | 0 |
| Cut to rows scoring 7 or above, free | skipped | 145 remain |
| One decision maker each, say 3 credits a result | about 3,000 | about 435 |
| Total | about 5,000 | about 1,195 |
Same source, same tools, same outcome for the rows you were ever going to email. The difference is entirely the order, and two filters that cost nothing.
Where to check what you actually spent
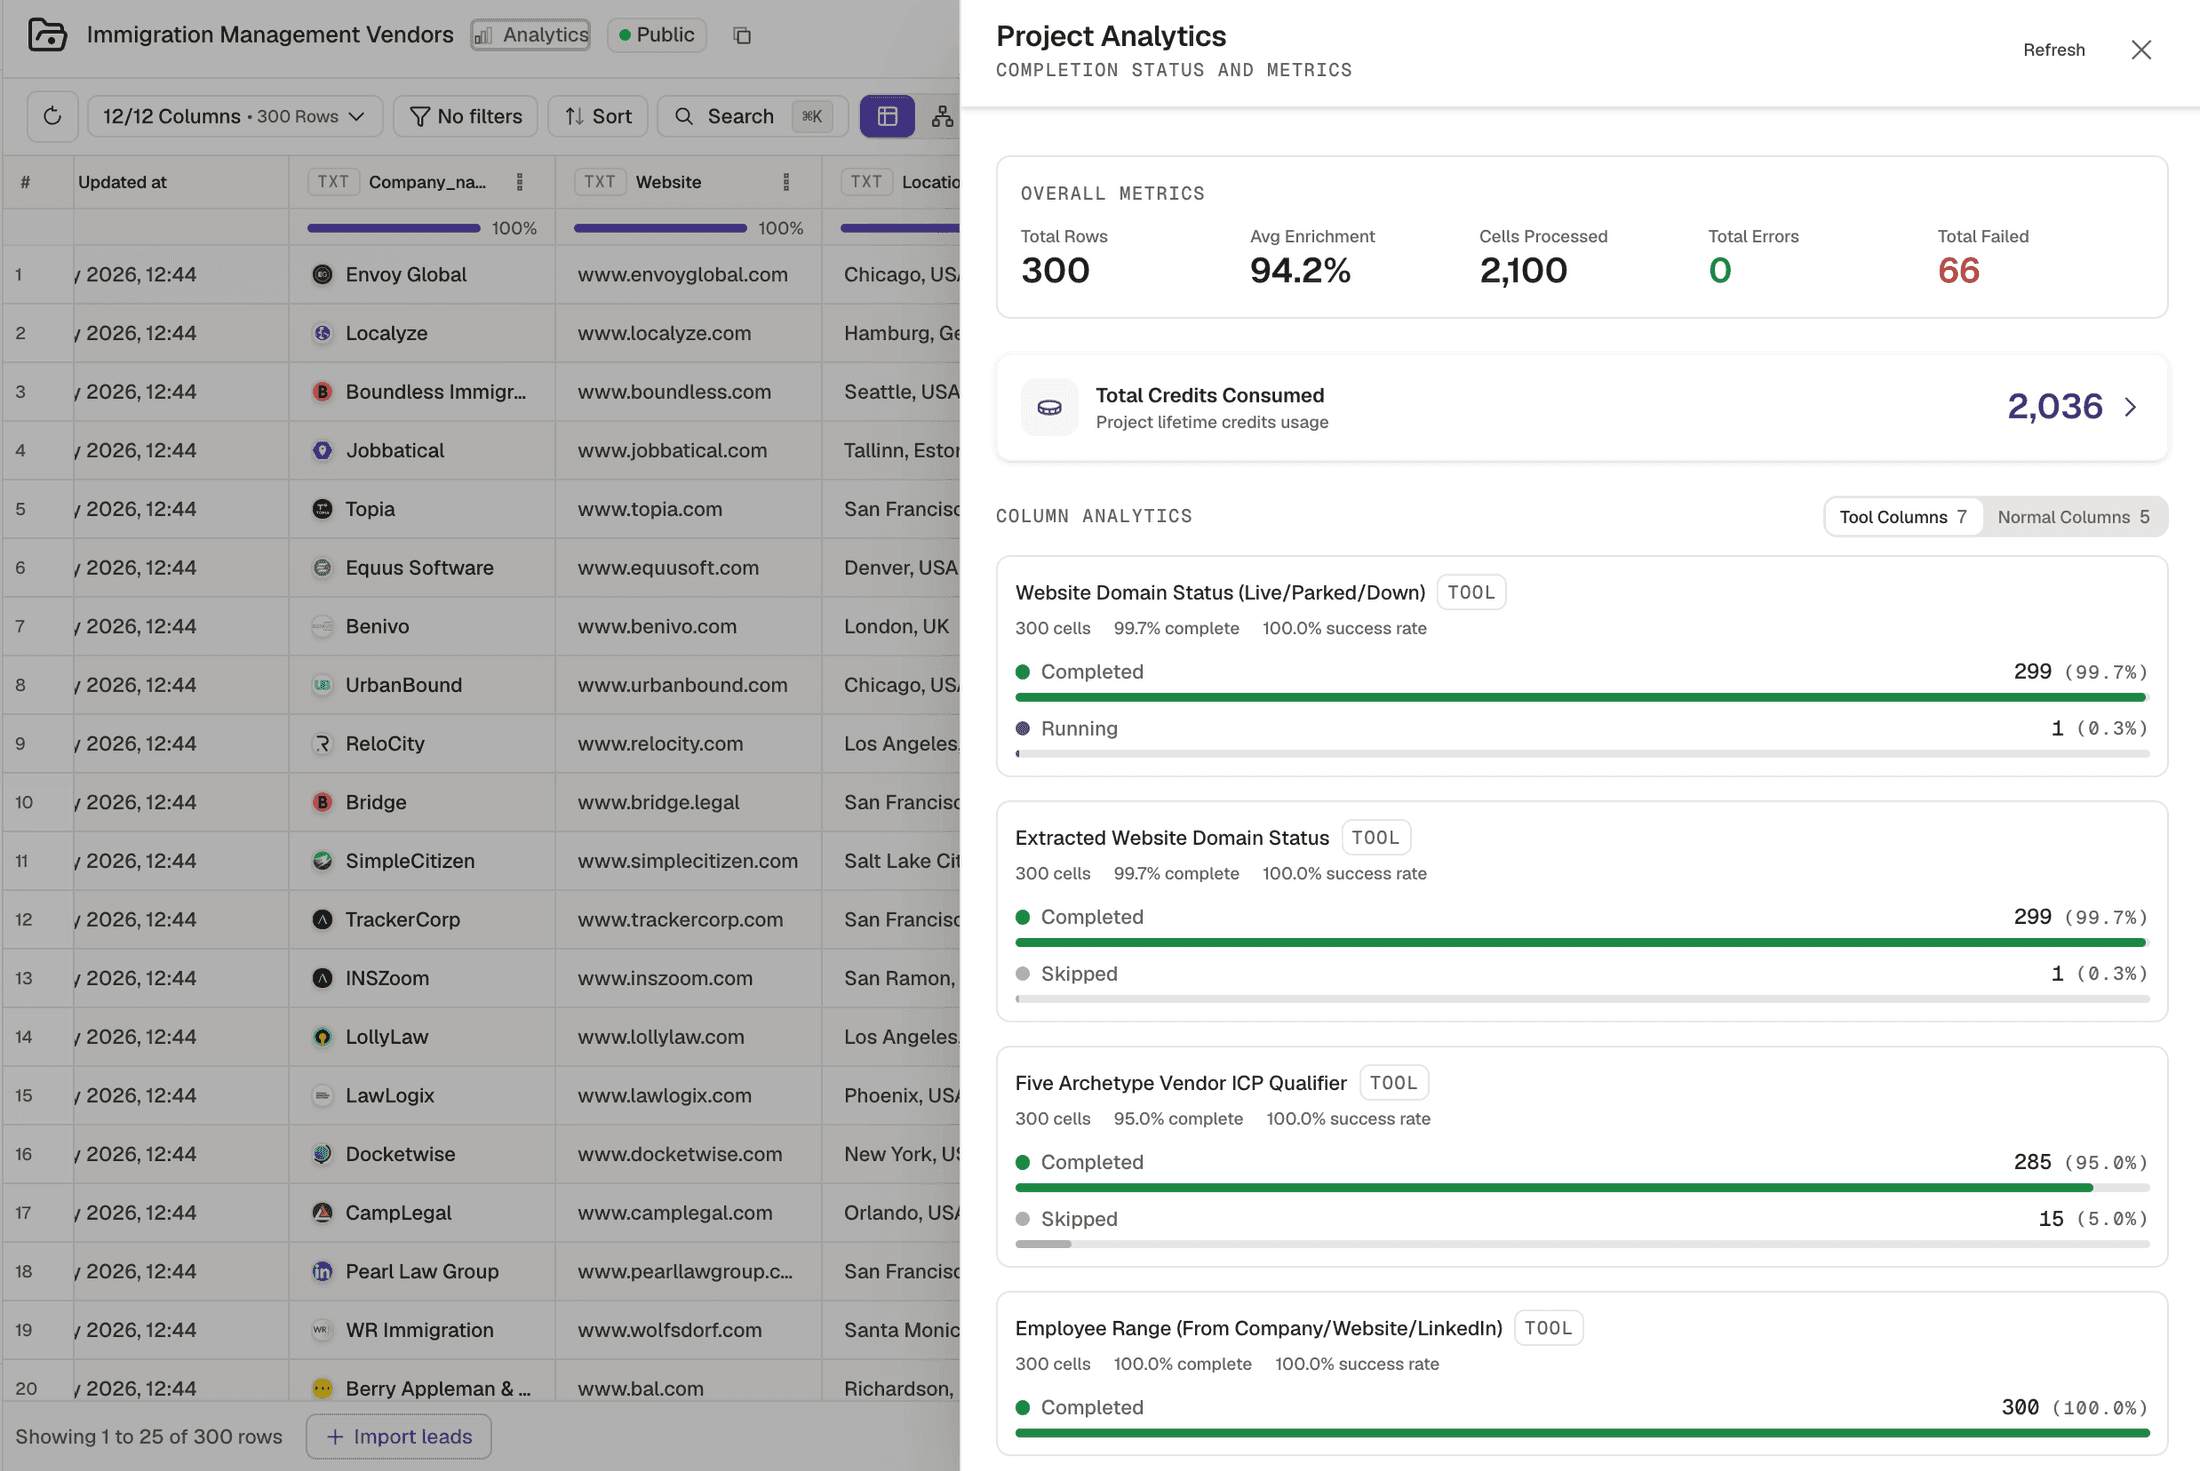
- 1Total credits consumed, for the life of this project.
- 2Average enrichment across the table. High spend with low enrichment means you paid to research rows that were never going to answer.
Your remaining credits sit in the top navigation of the dashboard. For a breakdown by action, open Settings and then Usage. If a run surprised you, that breakdown tells you which column did it, which is usually enough to spot the missing condition.
Ran an expensive tool before filtering
- What you see
- The balance drops by thousands on a list you then cut to a tenth
- The fix
- Filter, then select the visible rows, then run. When filters are active only visible rows are processed.
Deleted a column expecting a refund
- What you see
- Column gone, credits still spent
- The fix
- Deleting a column does not refund credits, the work was already done. Preview on a handful of rows before creating a column on all of them.
Read the unit price but not the behaviour badge
- What you see
- A per result tool costs far more than rows times unit price
- The fix
- One row can return several results. Read both badges on the card, not just the number.
Re ran a whole column to fix a few empty cells
- What you see
- Paying twice for rows that already worked
- The fix
- Successfully enriched rows are not re processed on a normal re run. Course 2.3 covers the advanced run options that control this.
Check yourself
0 of 3 answered1.A tool card shows a credit figure and the words "If result". What does a miss cost you?
2.A tool card shows a credit figure with no behaviour badge beside it. What does that mean?
3.You delete a column you regret creating. What happens to the credits?
Try it yourself
Take a project with at least 50 rows. Before running anything, write down what it would cost to add websites to every row, and what it would cost to add websites only to rows missing one. Then check the difference in the Usage breakdown after you run the second version.
- You have done it when
- Your predicted cost for the filtered run is within 10 percent of what was actually deducted.
- Credit budget
- Small, if you filter first. That is the whole exercise.
Related and next
- Help: How credits work in Kuration AI
- Help: Enrich only the rows that matter
- Next: reading a cell back to its source
Recipes that use this skill